|
Developing More Precise Testing and Modeling of HMA Mixtures to Predict Rutting in the Field
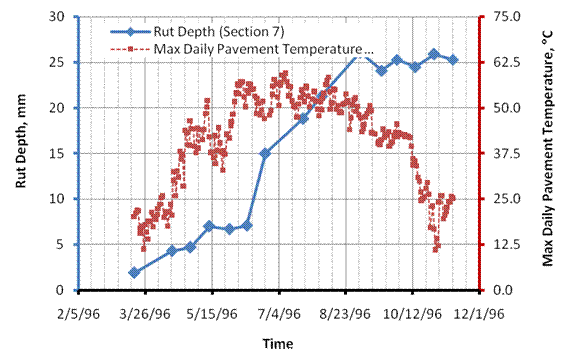
As HMA pavements are subjected to traffic loading in the field, their behaviors are highly dependent on the combination of rate of loading and in-situ temperature of the pavement. The rutting resistance of HMA mixtures is most significantly impacted by these parameters. Figure 1 shows a strong correlation between pavement temperature and rate of rutting under a constant number of loaded trucks. This correlation indicates that, even under constant loading conditions, HMA pavements will experience significant increases in rutting once their temperature reaches a critical level. Therefore, determining the stress state, as generated by the combination of rate of loading and temperature, in a pavement section is an essential step in any rut-depth predictive methodology that requires the use of mathematical modeling along with laboratory determined material properties. To achieve the greatest consistency in the modeling process, the determined stress state in the pavement needs to be appropriately duplicated in the laboratory testing of the HMA mixtures. As part of the ARC work on Critically Designed HMA Mixtures, the UNR research team is investigating methods that can precisely mimic the state of stresses in the field under laboratory testing conditions.
Figure 1. Rut depth and maximum pavement temperature as a function of time - WesTrack.
Brown and Bell suggested the use of stress invariants as the most appropriate method of representing the correct stress state for materials characterization. As indicated by their names, the stress invariant values are the same regardless of the orientation of the coordinate system chosen. For example, the first invariant of stress tensor (
where σ1, σ2, and σ3 are the principal stresses existing at the point of interest in the HMA layer. Equations 1 and 2 show that the same The octahedral normal and shear stresses are used to convert the stress tensor observed in the HMA layer under moving dynamic loads to deviator and confining stresses in a repeated load triaxial testing set-up (i.e. flow number test). In the laboratory, the triaxial condition is achieved by applying a static all around confining stress using compressed air and a repeated deviator vertical stress using an axial actuator to a 4-inch diameter by 6-inch high cylindrical HMA sample. Therefore, the deviator stress, σd, and the confining stress, i.e., σc = σ2 = σ3, can be written in function of the octahedral normal and shear stresses as follows:
Equations 3 and 4 show that the magnitude of the deviator and confining stresses in the triaxial test can be evaluated from the octahedral stresses generated in the HMA layer under a moving load. In order to define the magnitude of the deviator and confining stresses in the laboratory repeated load triaxial test, an experimental plan was carried out to estimate the magnitude of the octahedral stresses in HMA layers. Experimental Plan Under the experimental plan, a mechanistic analysis of HMA pavements subjected to moving 18-wheel truck at various speeds and under braking and non-braking conditions using the 3D-Move model was conducted. The pavement responses from the 3D-Move model were analyzed to identify the magnitude of the deviator and confining stresses throughout the HMA layer. The full experimental plan includes three HMA mixtures, three different pavement structures, two different road geometries (i.e. level and down grade road), four different loading speeds, two tire-pavement pressure distributions (uniform and non-uniform), and four different pavement temperatures (i.e. 40°C, 50°C, 60°C, and 70°C). The experimental plan is not fully completed yet, and only results for the completed mechanistic analyses are presented (refer to Table 1).
Table 1. Completed Mechanistic Analyses for the PG64-22 and PG52-22 Mixes
* An inflation pressure of 125 psi is used
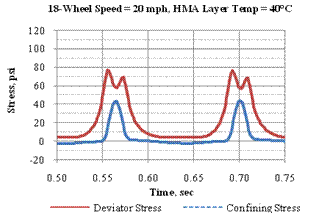
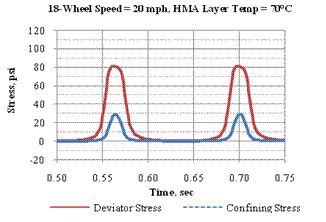
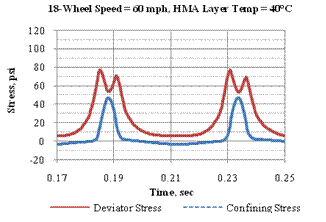
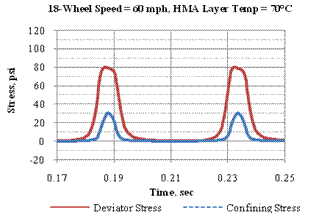
Mechanistic Analysis For each mixture type (i.e. PG64-22 and PG52-22), the pavement responses calculated by the 3D-Move model (i.e. principal stresses time-histories) along with Equations 1 and 2 are used to calculate the octahedral normal stress and the octahedral shear stress at 2-inch below pavement surface in the HMA layer. Then, using the calculated octahedral stresses time-histories in the HMA layer at different analysis temperature and truck speed, the corresponding deviator and confining stresses are calculated using Equations 3 and 4. Figure 2 shows, as an example, the calculated time-histories of the deviator and confining stresses in the PG64-22 HMA layer under the driving tandem axles. It should be noted that a dynamic (i.e. pulse load) confining stress is observed in the mechanistic analysis whereas a static confining pressure is applied in the laboratory test set-up due to well-known testing and equipment limitations.
Figure 2. Calculated deviator and confining stress histories at 2-inch below pavement surface (PG64-22 mix – pavement structure: 6” HMA over 8” base).
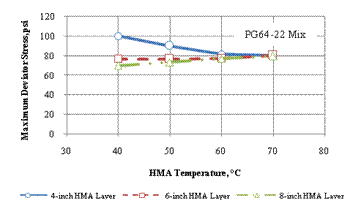
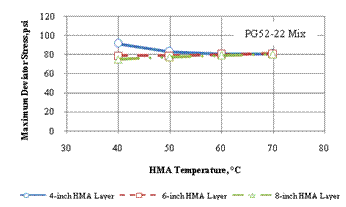
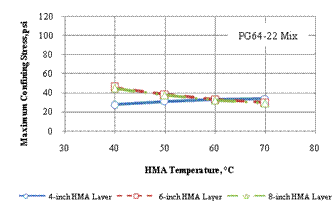
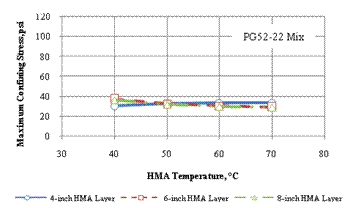
Maximum Deviator and Confining Stresses3D-Move mechanistic analyses showed that the PG64-22 mix experienced maximum deviator stress from 69-102 psi and and confining stress from 27-47 psi. The total vertical stress varied from 109-129 psi. In the case of the PG52-22 mix, the maximum deviator stress varied from 74-94 psi and the confining stress varied from 28-39 psi. The total vertical stress varied from 109-124 psi. Except in the case of the 4-inch HMA layer, an increase in the deviator stress and a decrease in the confining stress were observed with the increase in temperature. RecommendationsThe overall objective of this effort is to recommend a deviator stress and a confining stress to be applied in the laboratory-repeated load triaxial test at the high-performance temperature of the asphalt binder grade. Figure 3 shows that the deviator stress maintained an approximate value of 80 psi for both the PG64-22 and the PG52-22 mixtures after 60 and 50°C, respectively. Similarly, the confining stress maintained an approximate value of 32 psi for both the PG64-22 and the PG52-22 mixtures after 60 and 50°C, respectively. The data clearly show that the deviator and confining stresses maintained steady values at temperatures higher than the high-performance temperature of the corresponding asphalt binder grades. Therefore, use of a deviator stress and a confining stress of 80 psi and 32 psi, respectively, is recommended at the high-performance temperature of the asphalt binder in question. The final recommended values for the deviator and confining stresses to be applied in the laboratory-repeated load triaxial test set-up are summarized in Table 2. It should be noted that the recommended values represent an 18-wheel truck traveling at a speed between 20 and 60 mph without braking and a tire inflation pressure of 125 psi.
Figure 3. Average deviator and confining stresses.
Table 2 Recommended Deviator and Confining Stresses.
* recommended values for an 18-wheel truck traveling at a speed between 20 and 60 mph without braking and a tire inflation pressure of 125 psi.
The above recommendations will be further refined when the full experimental plan is completed and all the data from the mechanistic analysis are analyzed. In addition, the deviator stress time-history data are under evaluation to determine the time of loading at 2 inches below the pavement surface. The time of loading is determined by best fitting a sinusoidal wave shape for the deviator stress pulses calculated from the octahedral shear stress (toct) in the various HMA pavements under the moving 18-wheel truck at different speeds and temperatures. Additional recommendations based on the results will be provided for the deviator stress loading pulse time to be applied in the flow number test.
|
|
Asphalt Research Correspondent |
